Looking for fresh ideas to design your next infographic? This article gives you more than 25 creative infographic styles to help you turn complex info into visuals that are clear, useful, and interesting.
Infographics are great for sharing detailed information in a way that’s easy to understand. When you try different styles, you can tell your story better and keep people’s attention. Whether you want to explain a process, compare data, or highlight trends, there’s a design here for you.
If you use a tool like Infogram, it’s even easier. Infogram comes with helpful features like an AI-powered infographic maker, data import options, interactive elements, and smart chart suggestions to make your work easier and faster.
Let’s take a look at some popular infographic design ideas you can try.
1. Timeline Infographic
Perfect for showing events in order over time—like a company’s growth or product milestones. Use icons, colors, and even clickable dates to make it more fun and easy to follow.
2. Comparison Infographic
This layout helps you compare two or more things side by side—like features, benefits, or stats. Use clear visuals, strong color contrast, and simple text to help people spot differences quickly.
3. Statistical Infographic
Use charts, graphs, and numbers to tell a story with data. Highlight key stats with big text and color. Keep it clean and focused so people get the point fast.
4. Process Infographic
Show a step-by-step process clearly. Use arrows, phases, and labels to explain each stage. This is great for tutorials, how-tos, or workflows.
5. Map Infographic
If your data is about places, show it on a map. You can use pins, colors, or animations to make it more interactive. Great for showing location trends or travel info.
6. Hierarchical Infographic
Use a pyramid or tiered layout to show how things are ranked or organized. It’s useful for org charts, business systems, or decision-making flows.
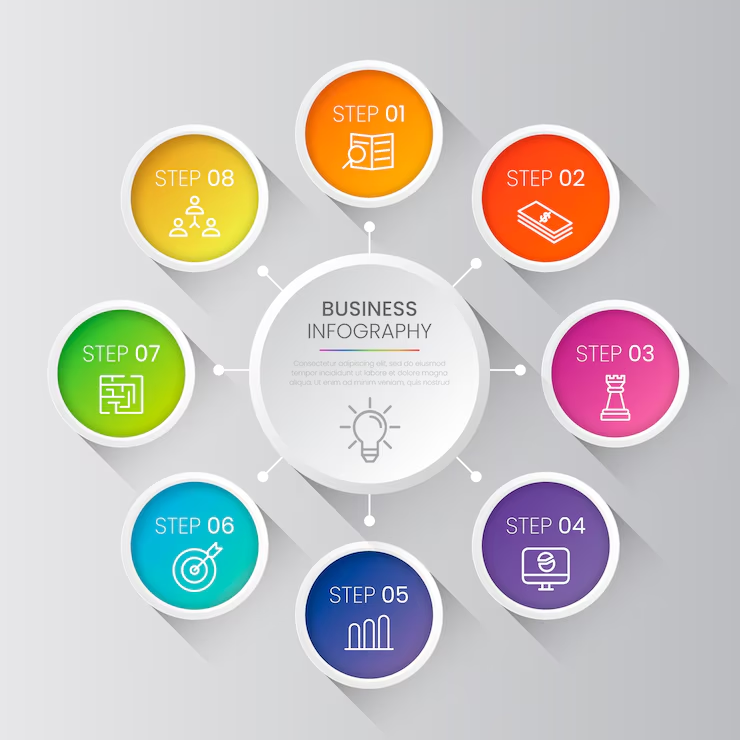
7. Circular Infographic
Good for cycles or processes that repeat. A circular design helps show how everything is connected and flows from one step to the next.
8. Flowchart Infographic
Perfect for decision trees or if-this-then-that type logic. Helps people follow a path or process easily with clear steps.
9. Interactive Infographic
Add hover effects, click-to-view data, or scroll animations. This lets viewers explore your info at their own pace and keeps them engaged.
10. Mind Map Infographic
Show how different ideas connect to one main topic. Use branches and colors to keep things organized. Ideal for brainstorming and education.
11. Watercolor Infographic
Add a soft, artistic look with watercolor backgrounds or textures. Great for creative topics, lifestyle brands, or environmental themes.
12. Minimalist Infographic
Keep it simple—use clean fonts, white space, and just a few colors. This style looks modern and makes the message easy to grasp.
13. Storyboard Infographic
Tell a story using drawings or illustrations in a comic-style layout. Helps make complex topics easy and fun to follow.
14. Photography Infographic
Use real photos with text or stats layered on top. Great for emotional topics, products, or campaigns with a strong visual story.
15. Monochromatic Infographic
Stick to one color, using light and dark shades to add depth. It’s stylish, easy on the eyes, and perfect for business or reports.
16. Comic-Style Infographic
Use cartoon panels, speech bubbles, and fun characters to explain something in a playful way. Great for education or younger audiences.
17. Typography-Based Infographic
Let the text design do the talking. Use big numbers, bold keywords, and cool fonts to tell the story in a visual way.
18. Data Art
Turn data into beautiful artwork. Create patterns or shapes that show data in a creative, unexpected way. Ideal for exhibitions or creative projects.
19. Collage Infographic
Mix photos, sketches, and textures like a scrapbook. This makes it feel more personal—great for travel, lifestyle, or storytelling.
20. Retro Infographic
Use vintage colors and fonts to give a nostalgic feel. Perfect for history topics or brands with a retro vibe.
21. Animated Infographic
Add motion to charts or text to make your visuals more exciting. Works well for social media or digital campaigns.
22. Infographic Poster
Create a bold, simple design that can stand alone as a print or digital poster. Great for events, facts, or key messages.
23. Puzzle Layout Infographic
Use puzzle pieces to show how different parts fit into a bigger system. Ideal for teamwork or process-related topics.
24. Infographic Resume
Make your CV visual with skill charts, timelines, and icons. This style helps you stand out with a creative and modern resume.
25. Ecosystem Infographic
Show how different systems or elements are connected. Great for topics like sustainability, supply chains, or business systems.
26. Branded Infographic
Use your brand colors, logo, and fonts to keep your infographic consistent with your identity. Great for marketing, reports, and product overviews.
Explore Even More Infographic Ideas
These ideas are just a starting point. You can mix and match styles or try something new. If you want more inspiration, check out Infogram’s example page. It’s full of real infographics made by users across different industries.
Try a new design on your next project and see how much more engaging your visuals can be!
Related Post;Creative Infographic Ideas to Inspire Your Next Design